
Climate Change & Mosquitoes
RESEARCH
STRATEGY
Phase 01: The Wicked Problem
For my info design final, I wanted to tackle climate change in a way that actually felt relevant to my generation. The thing is, most Gen Z-ers already know climate change is real, but it still feels distant, like something that'll matter more later. So instead of making another broad overview, I focused on something way more immediate: mosquito season. Warmer temperatures and increased flooding are directly making mosquito seasons longer, pushing mosquitoes into states that never had them, and driving up public health costs, and most people have no idea those two things are even connected.
Phase 02: Research + Audience
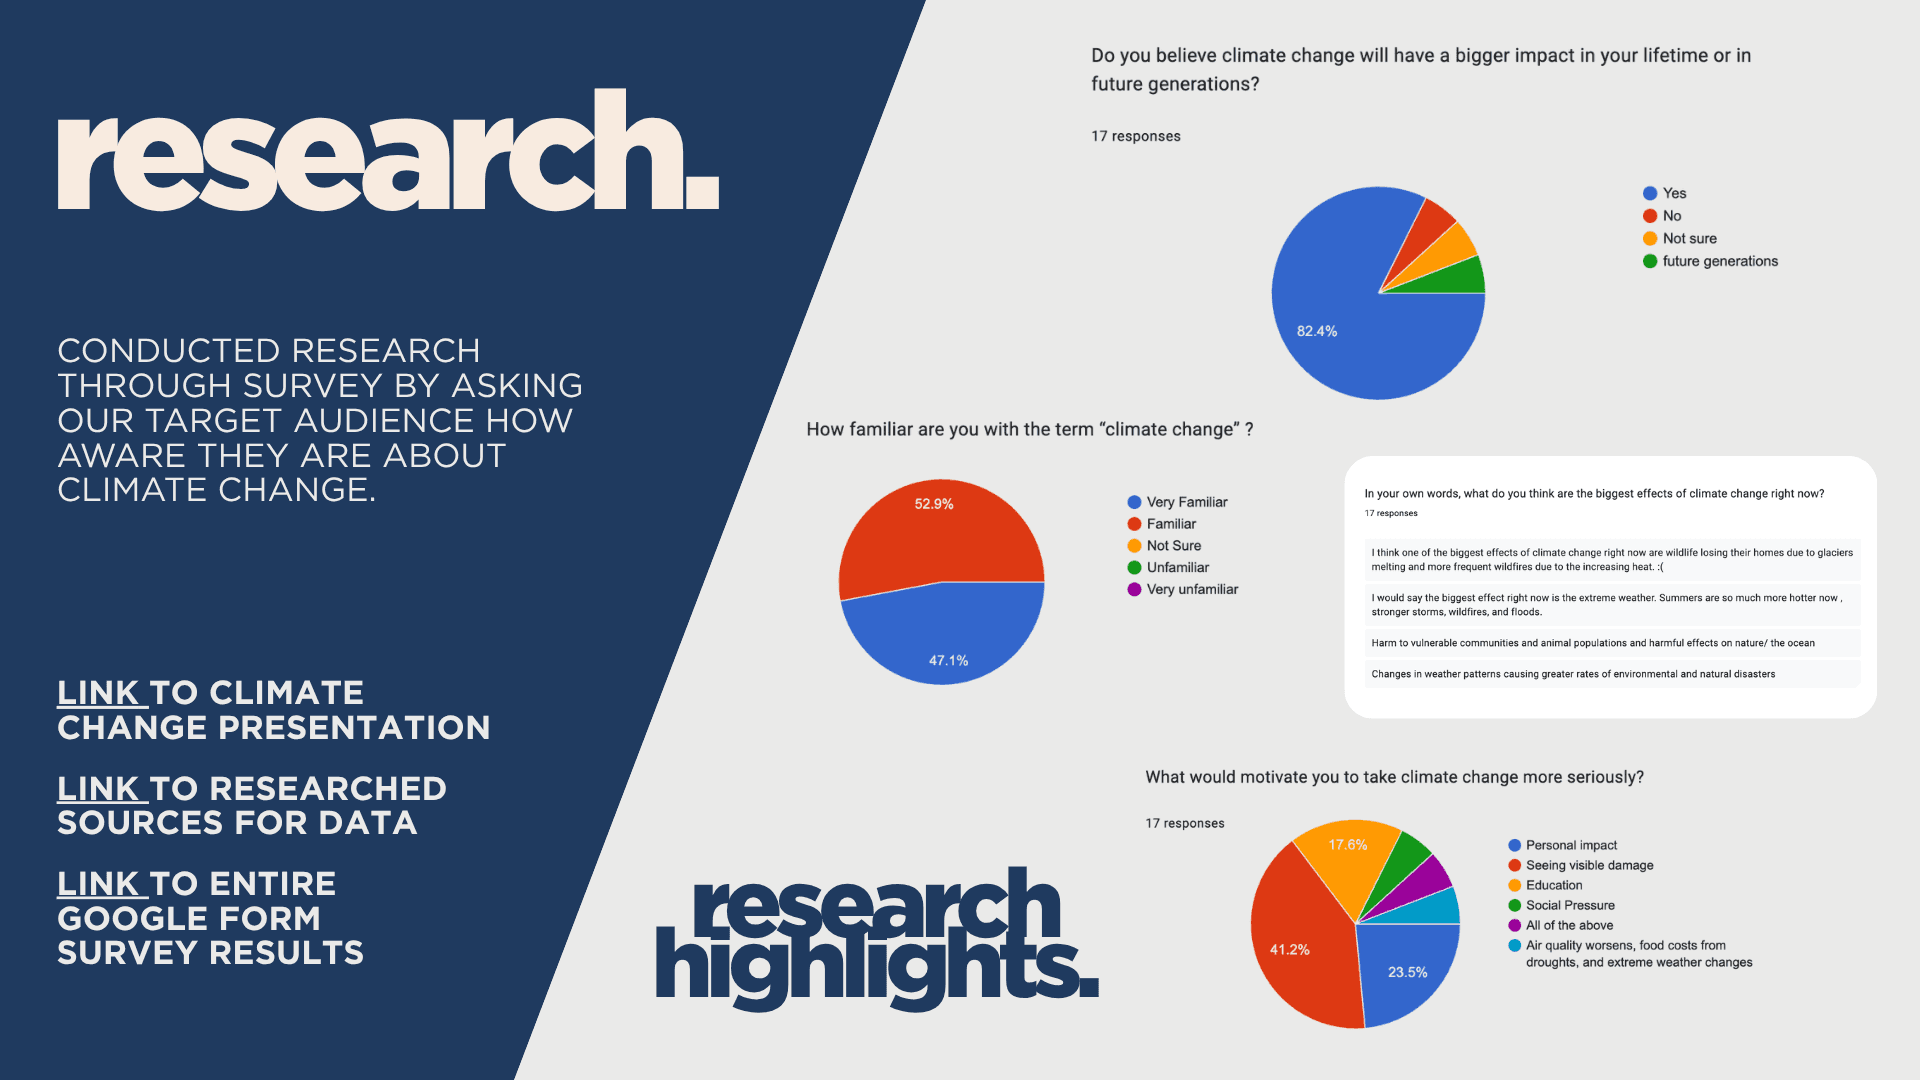
Before jumping into design, my research group and I ran a survey to understand where our audience's awareness actually sat. We found that while 82.4% of respondents believed climate change would impact their lifetime, responses were almost split down the middle on how familiar they actually felt with it. The biggest thing that would motivate people to take it more seriously was personal impact, which confirmed my whole direction. A mosquito bite is about as personal and tangible as it gets.
Phase 03: Visual Development
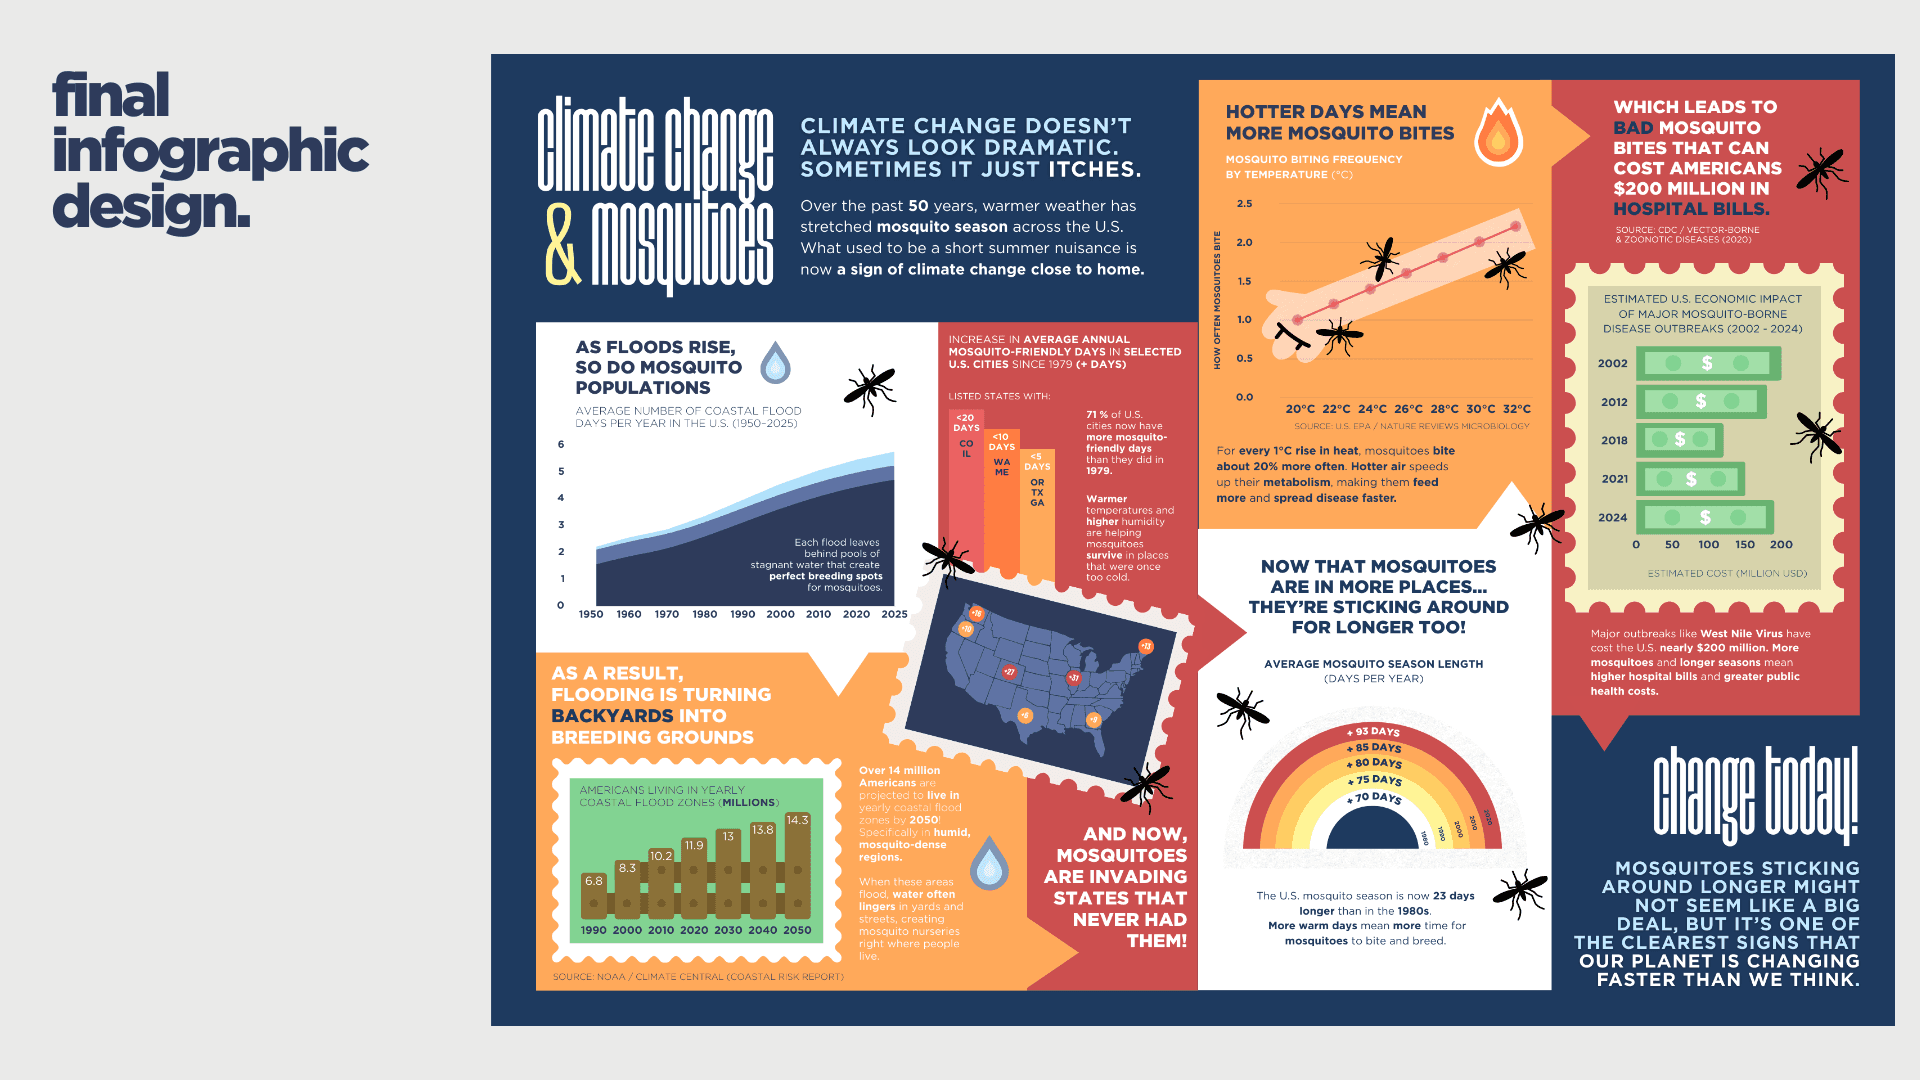
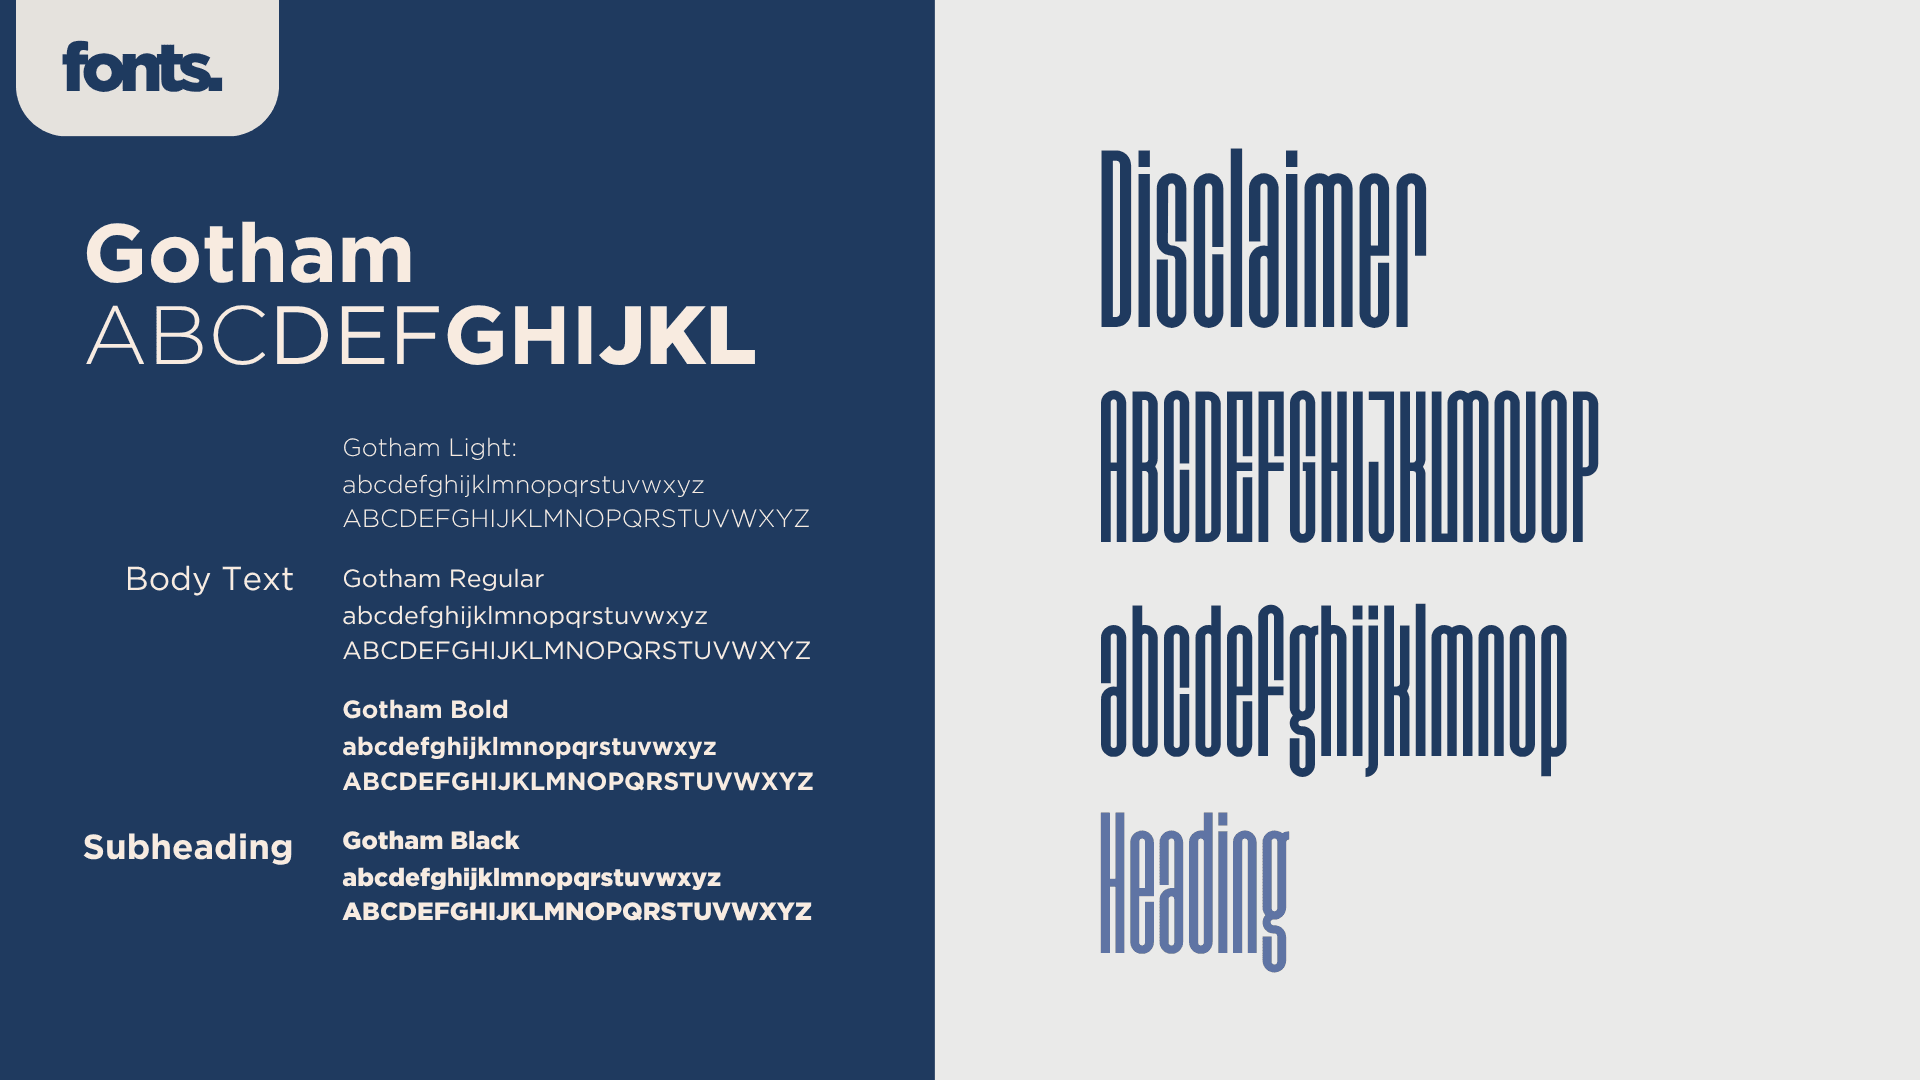
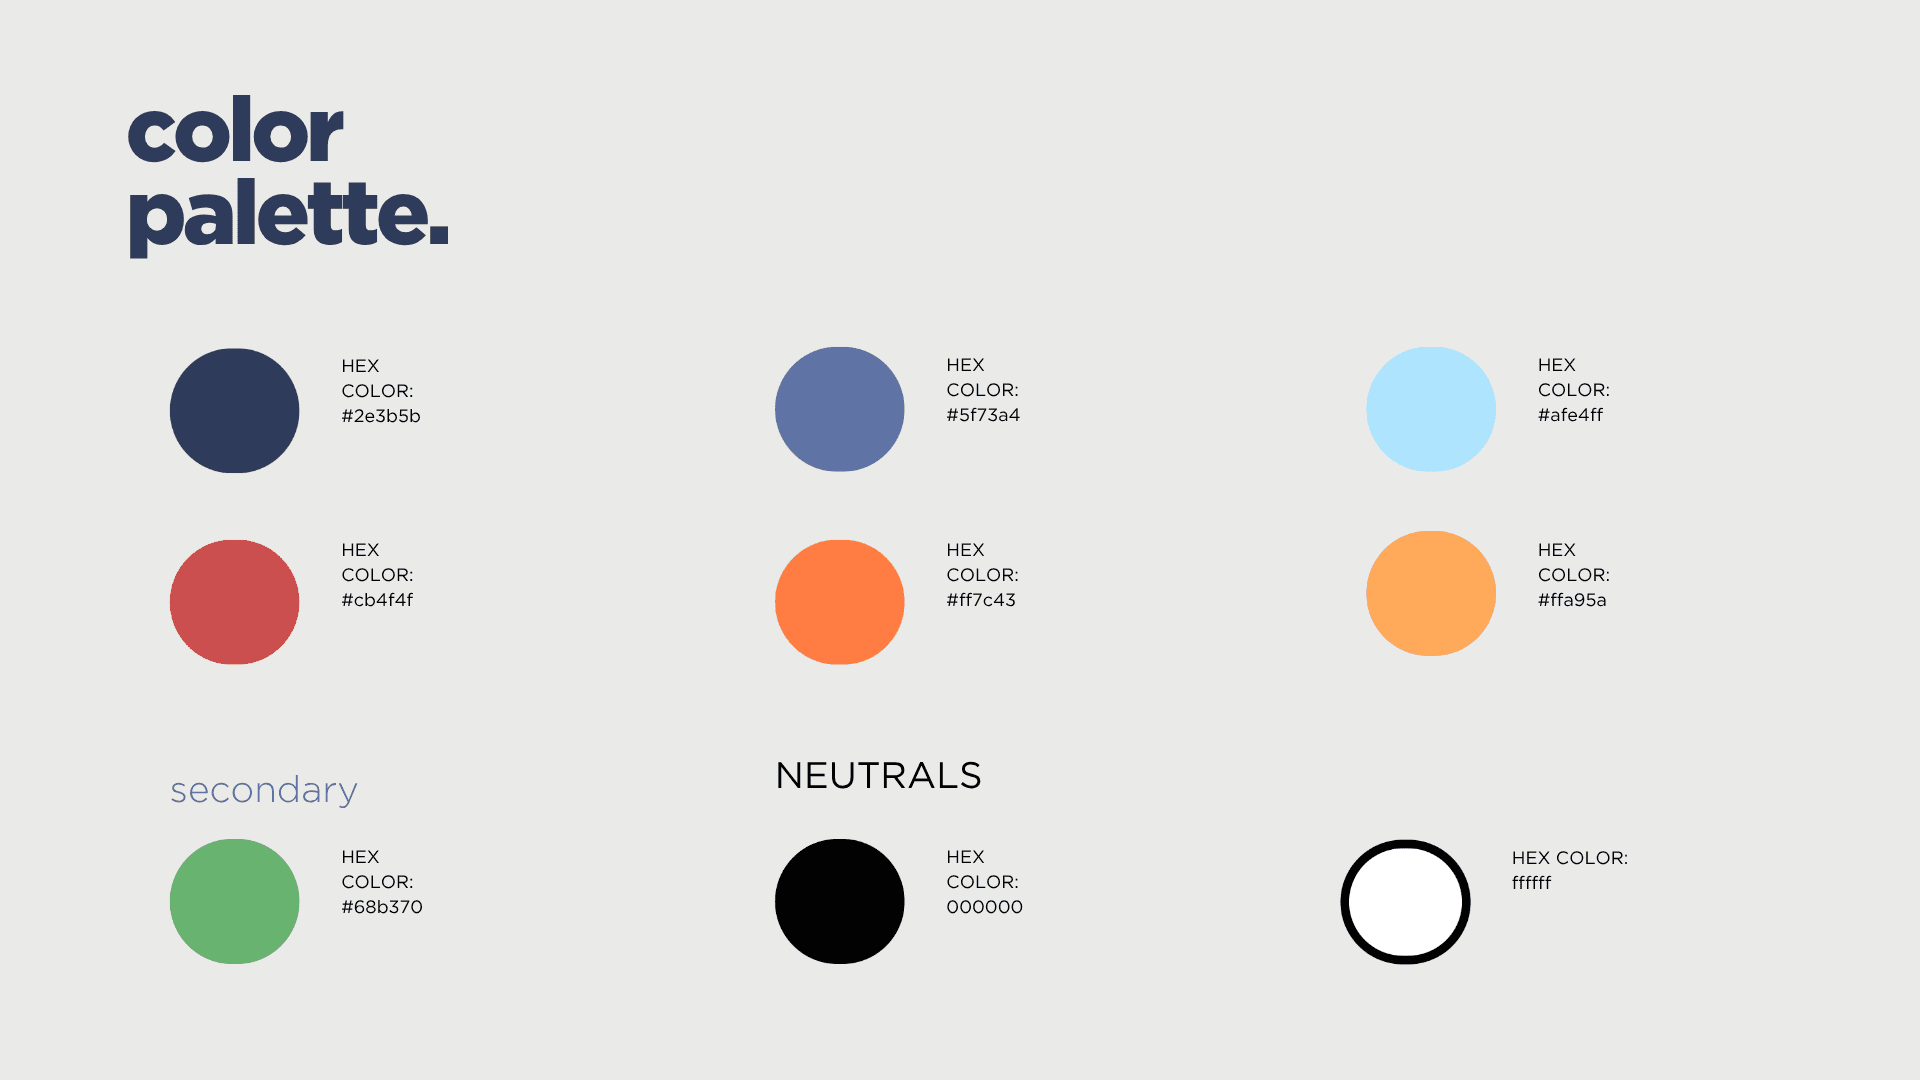
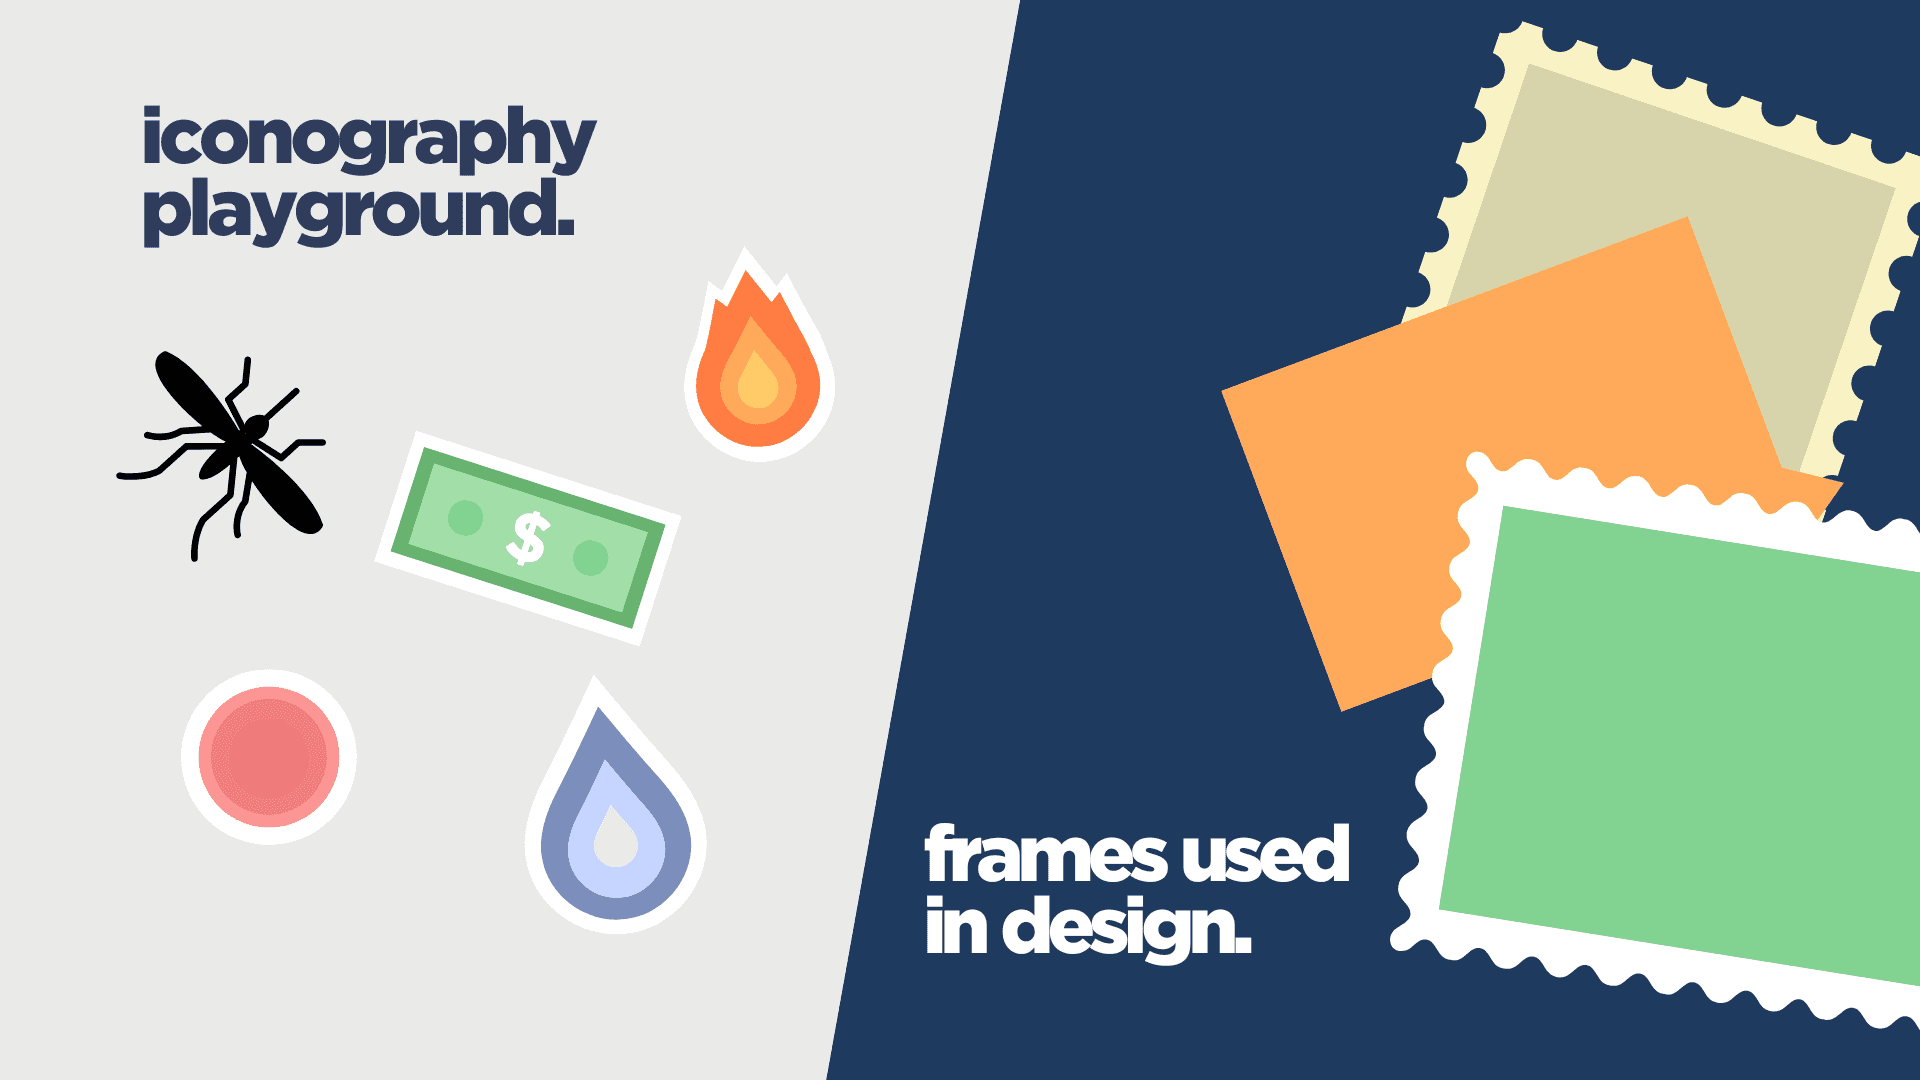
From there I built out the visual language around a bold, geometric, saturated aesthetic, anchoring on a deep navy palette with warm orange and red accents to communicate heat, and light blue for water and flooding. Those two elements, heat and water, are literally the two climate factors the whole infographic is built around so the colors had to reflect that. I used Gotham throughout for typography, leaning heavy on the black weight for the punchy headline-style copy, and developed a custom icon set alongside postage stamp frames as a recurring motif.
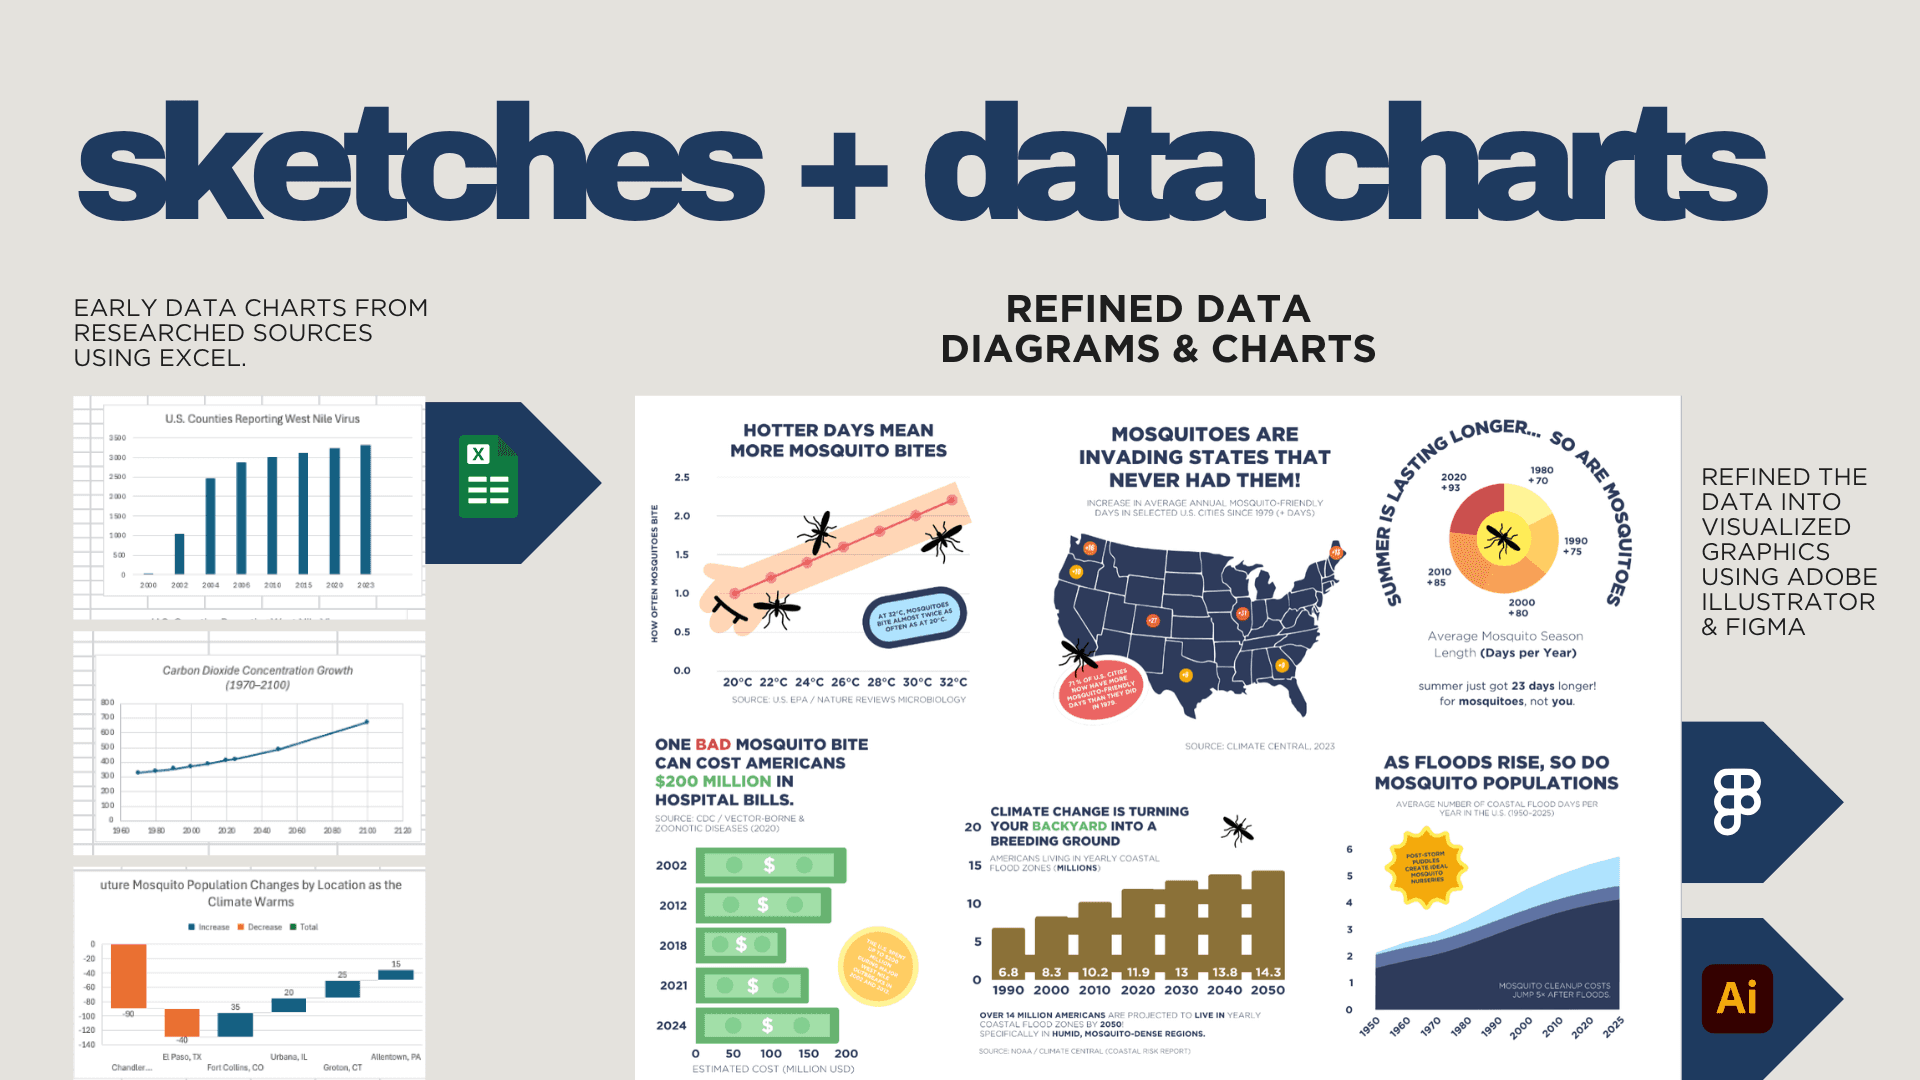
A big part of the design work was also rewriting scientific data into more direct, click-bait-style captions that actually land, things like "71% of U.S. cities now have more mosquito-friendly days than they did in 1979" rather than just dropping a plain stat.
Phase 04: Final Deliverables
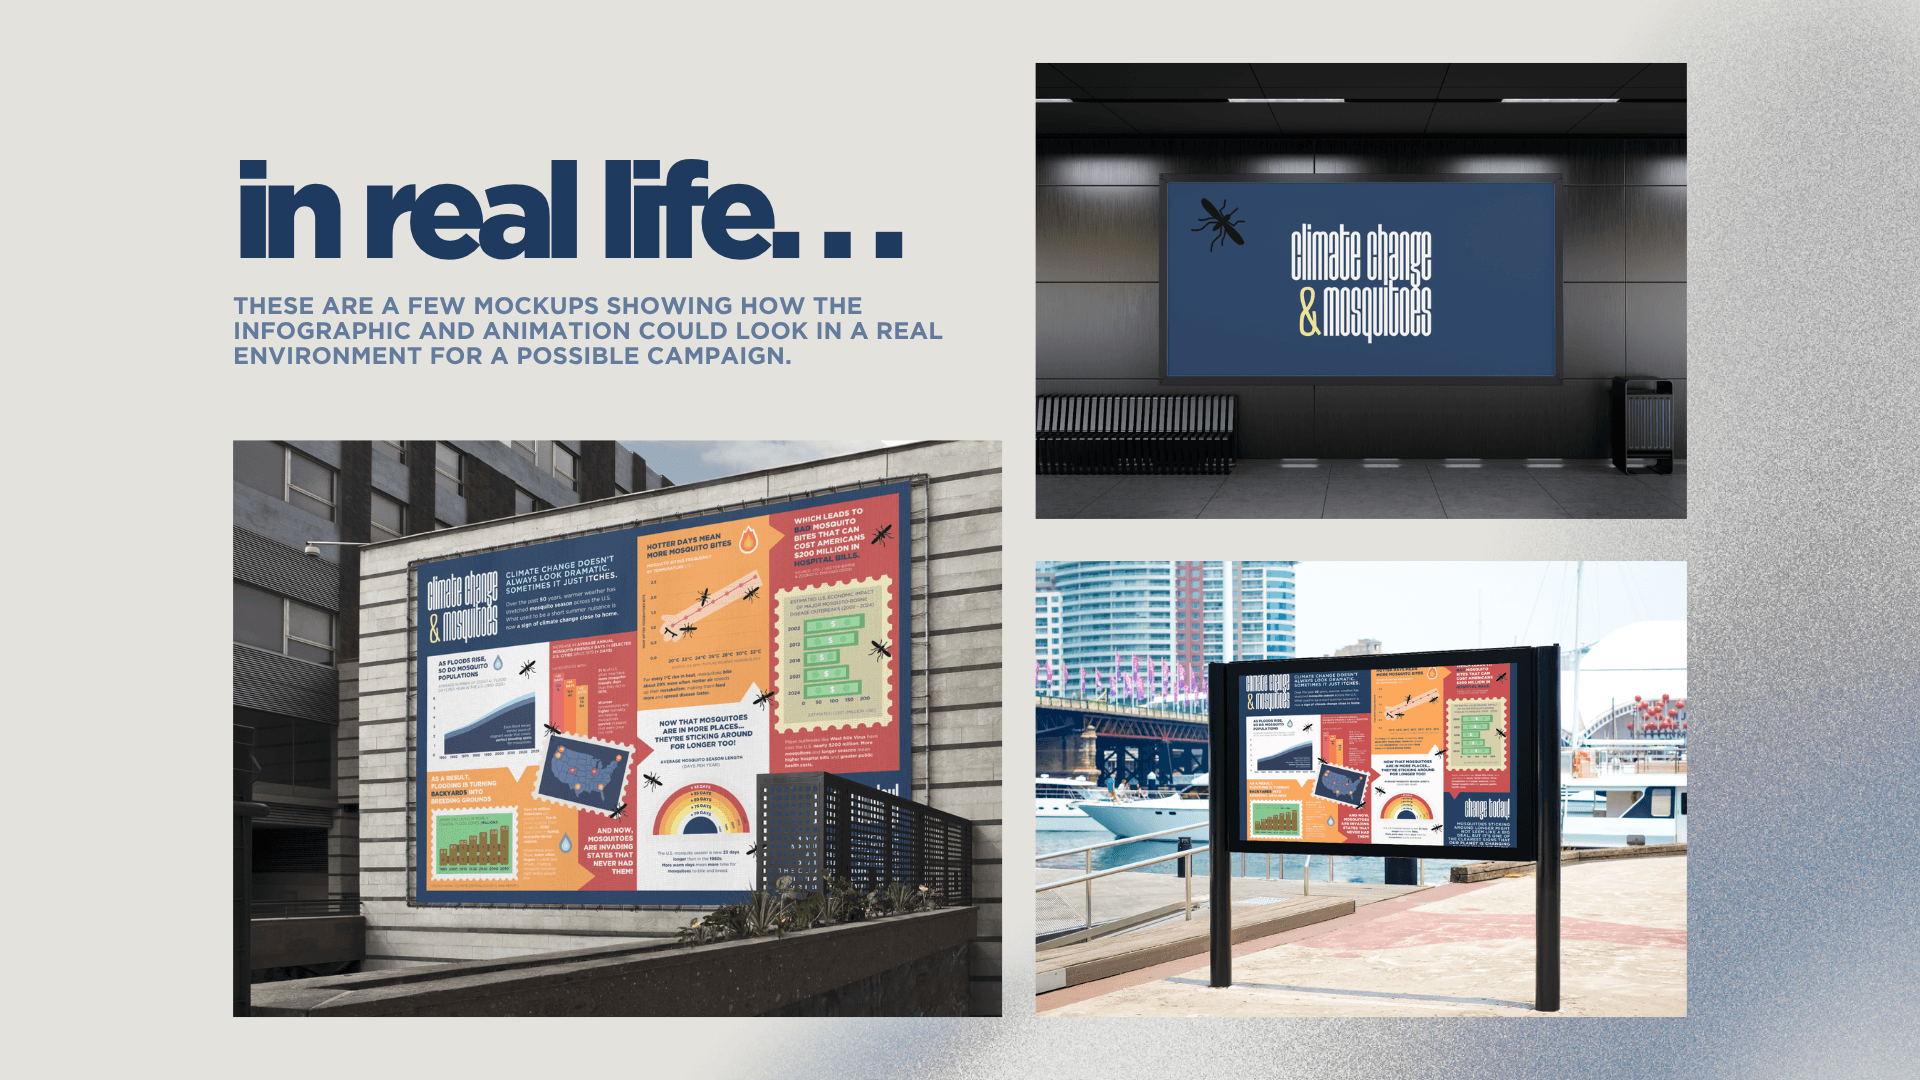
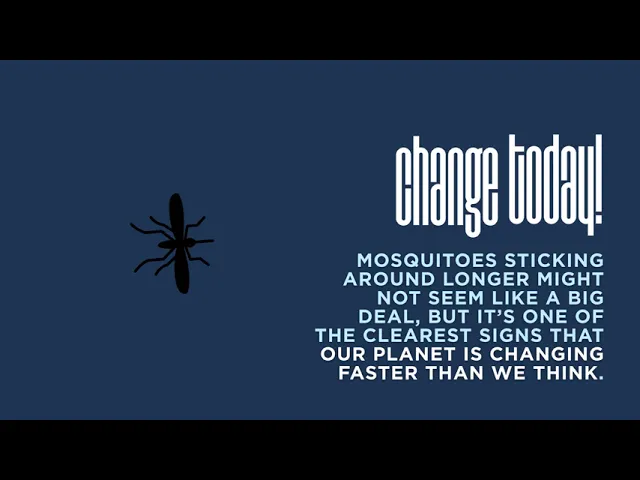
The final project came out as a full infographic covering four connected data stories, a motion graphic animation built in After Effects extending the same visual system, and a series of environmental mockups showing the campaign living as billboards and transit ads. The whole piece closes on "change today!" with the bigger takeaway that mosquitoes sticking around longer is one of the clearest everyday signs that our climate is already shifting, whether we notice it or not.